Read-only operations view
See every decision path while the engine is running.
BlazeRules Dashboard follows agent statistics, decision output, model channels, active rulesets, and dead-letter files. It can observe multiple local instances without sitting in the evaluation path.
01 / OVERVIEW
Throughput, outcomes, and data quality in one frame.
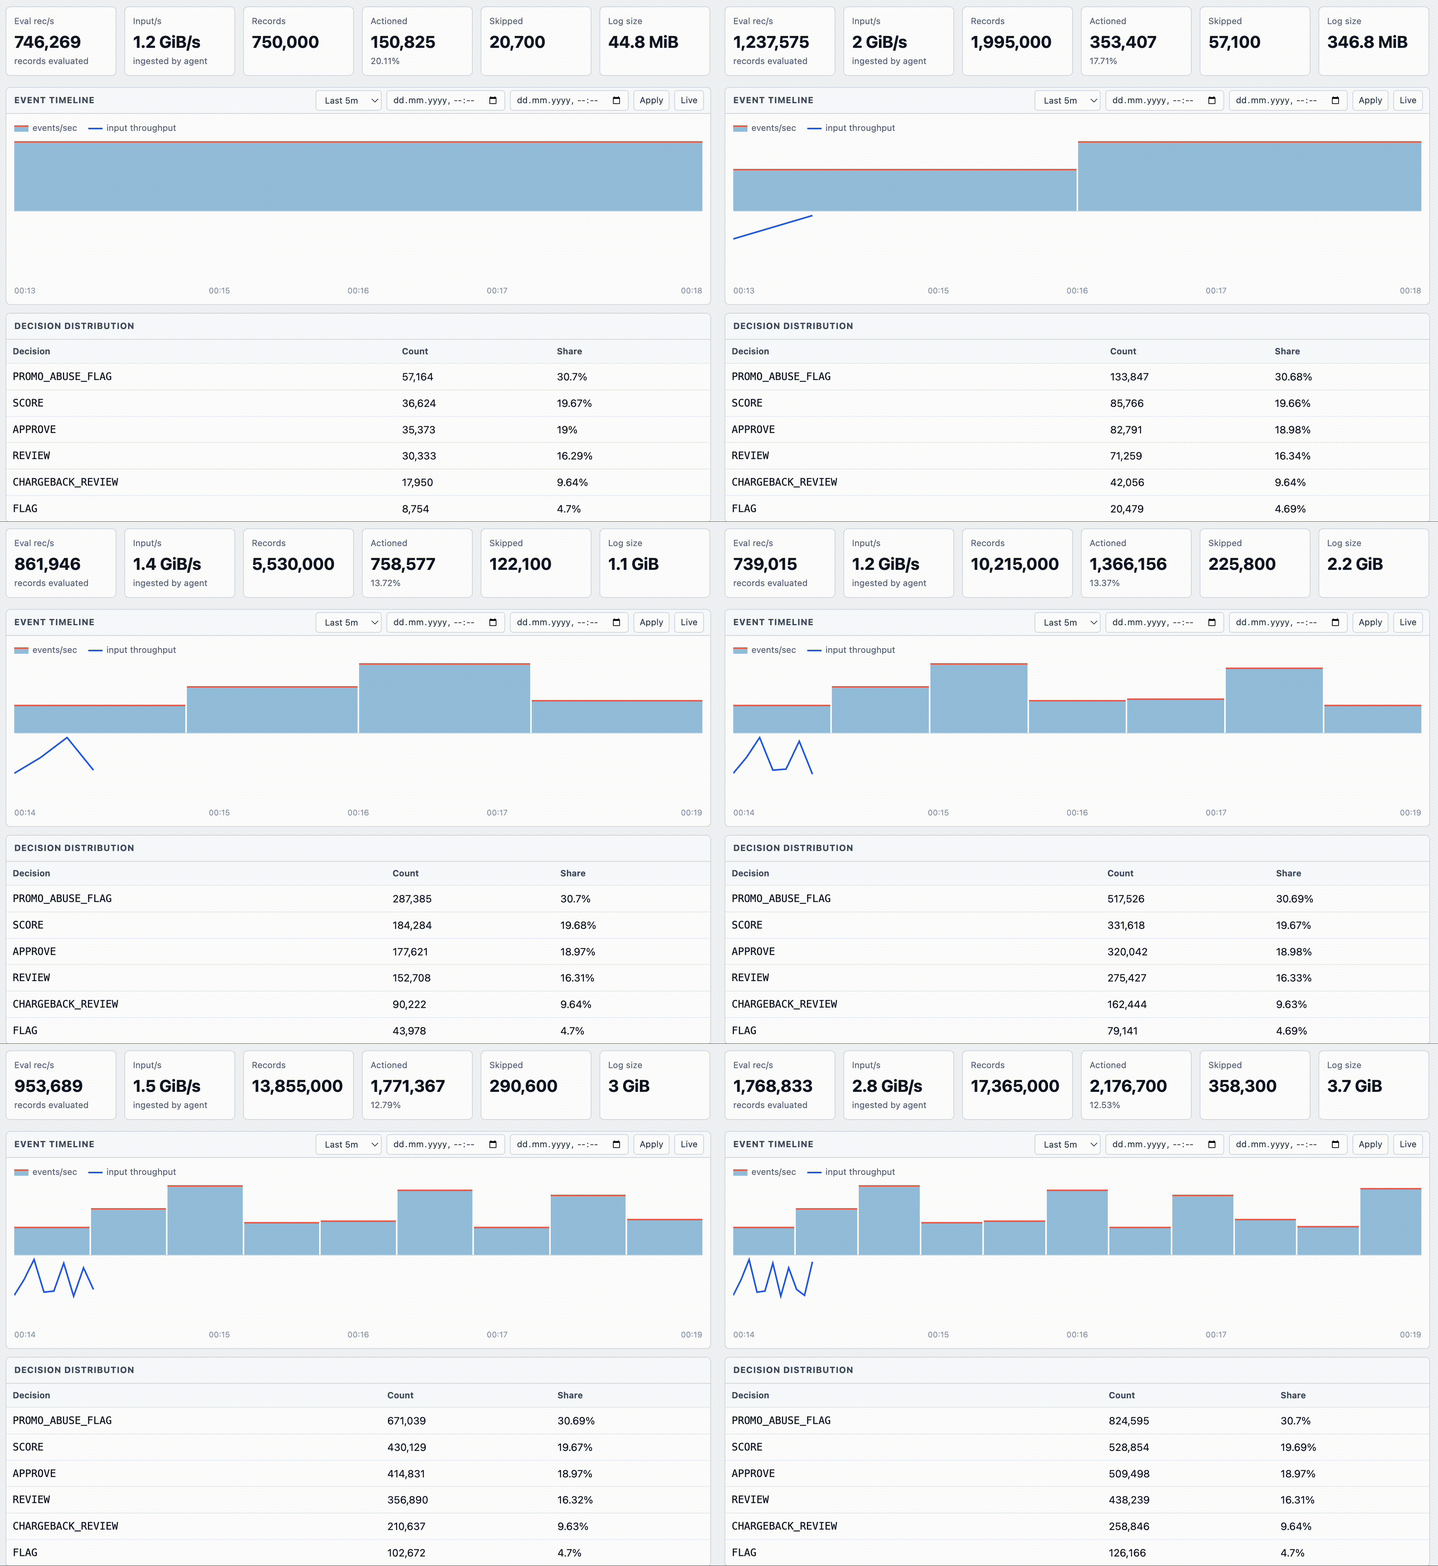
The first view answers the operational questions that matter during a live run: how fast events are evaluated, how much data is entering the agent, how many records were actioned, and how many were skipped.
- Live rate cards
- Evaluation rate, input throughput, record count, actioned count, skipped count, and log size.
- Ruleset scope
- Switch between one observed instance and the combined view.
- Outcome mix
- Compare standard and custom decision labels with counts and shares.
02 / EVENT TIMELINE
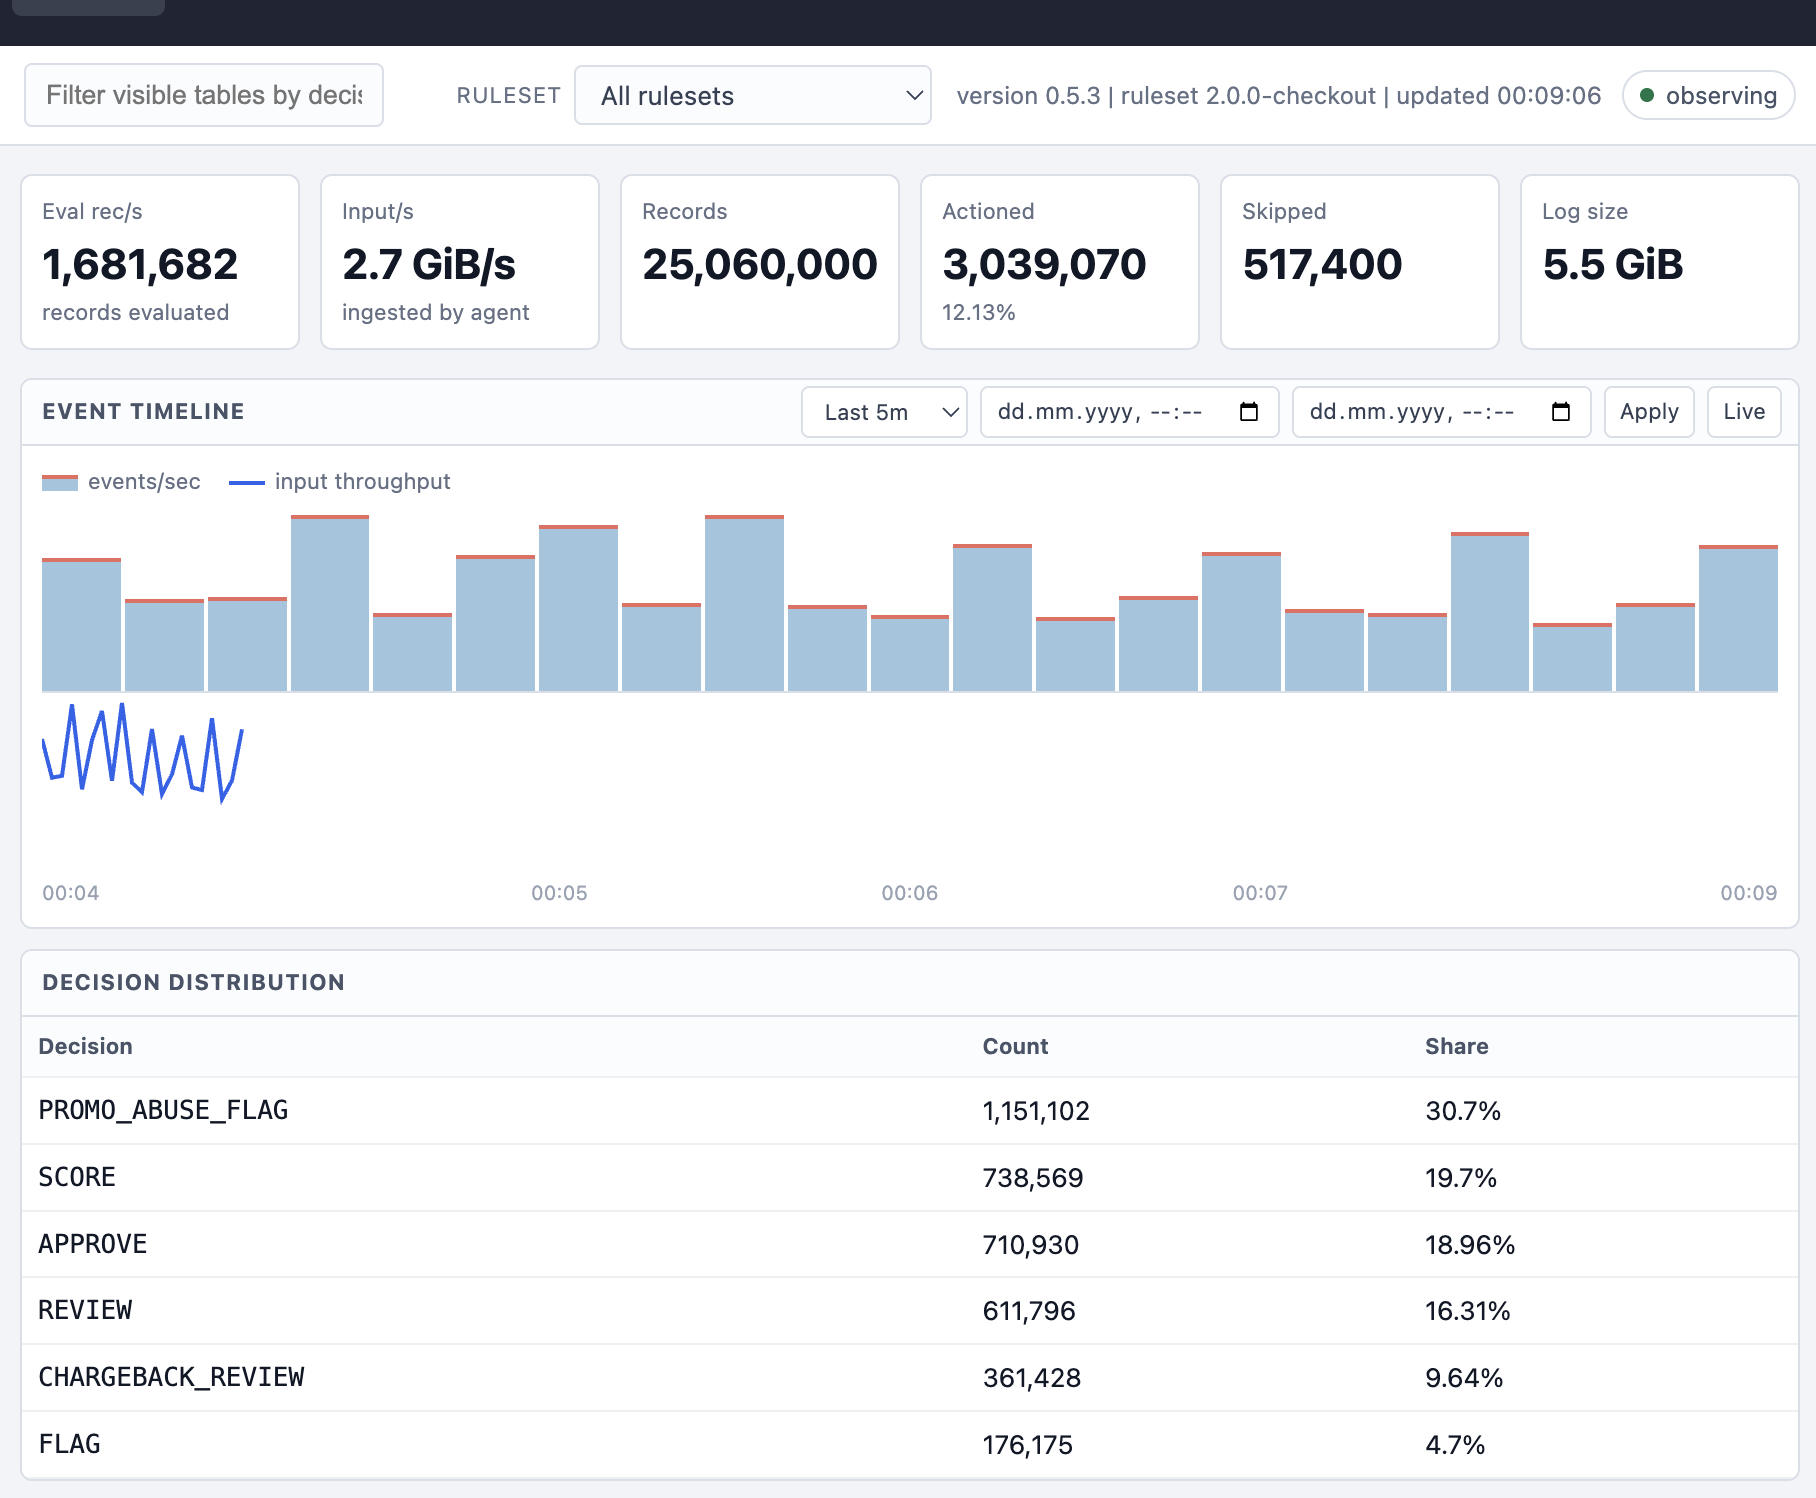
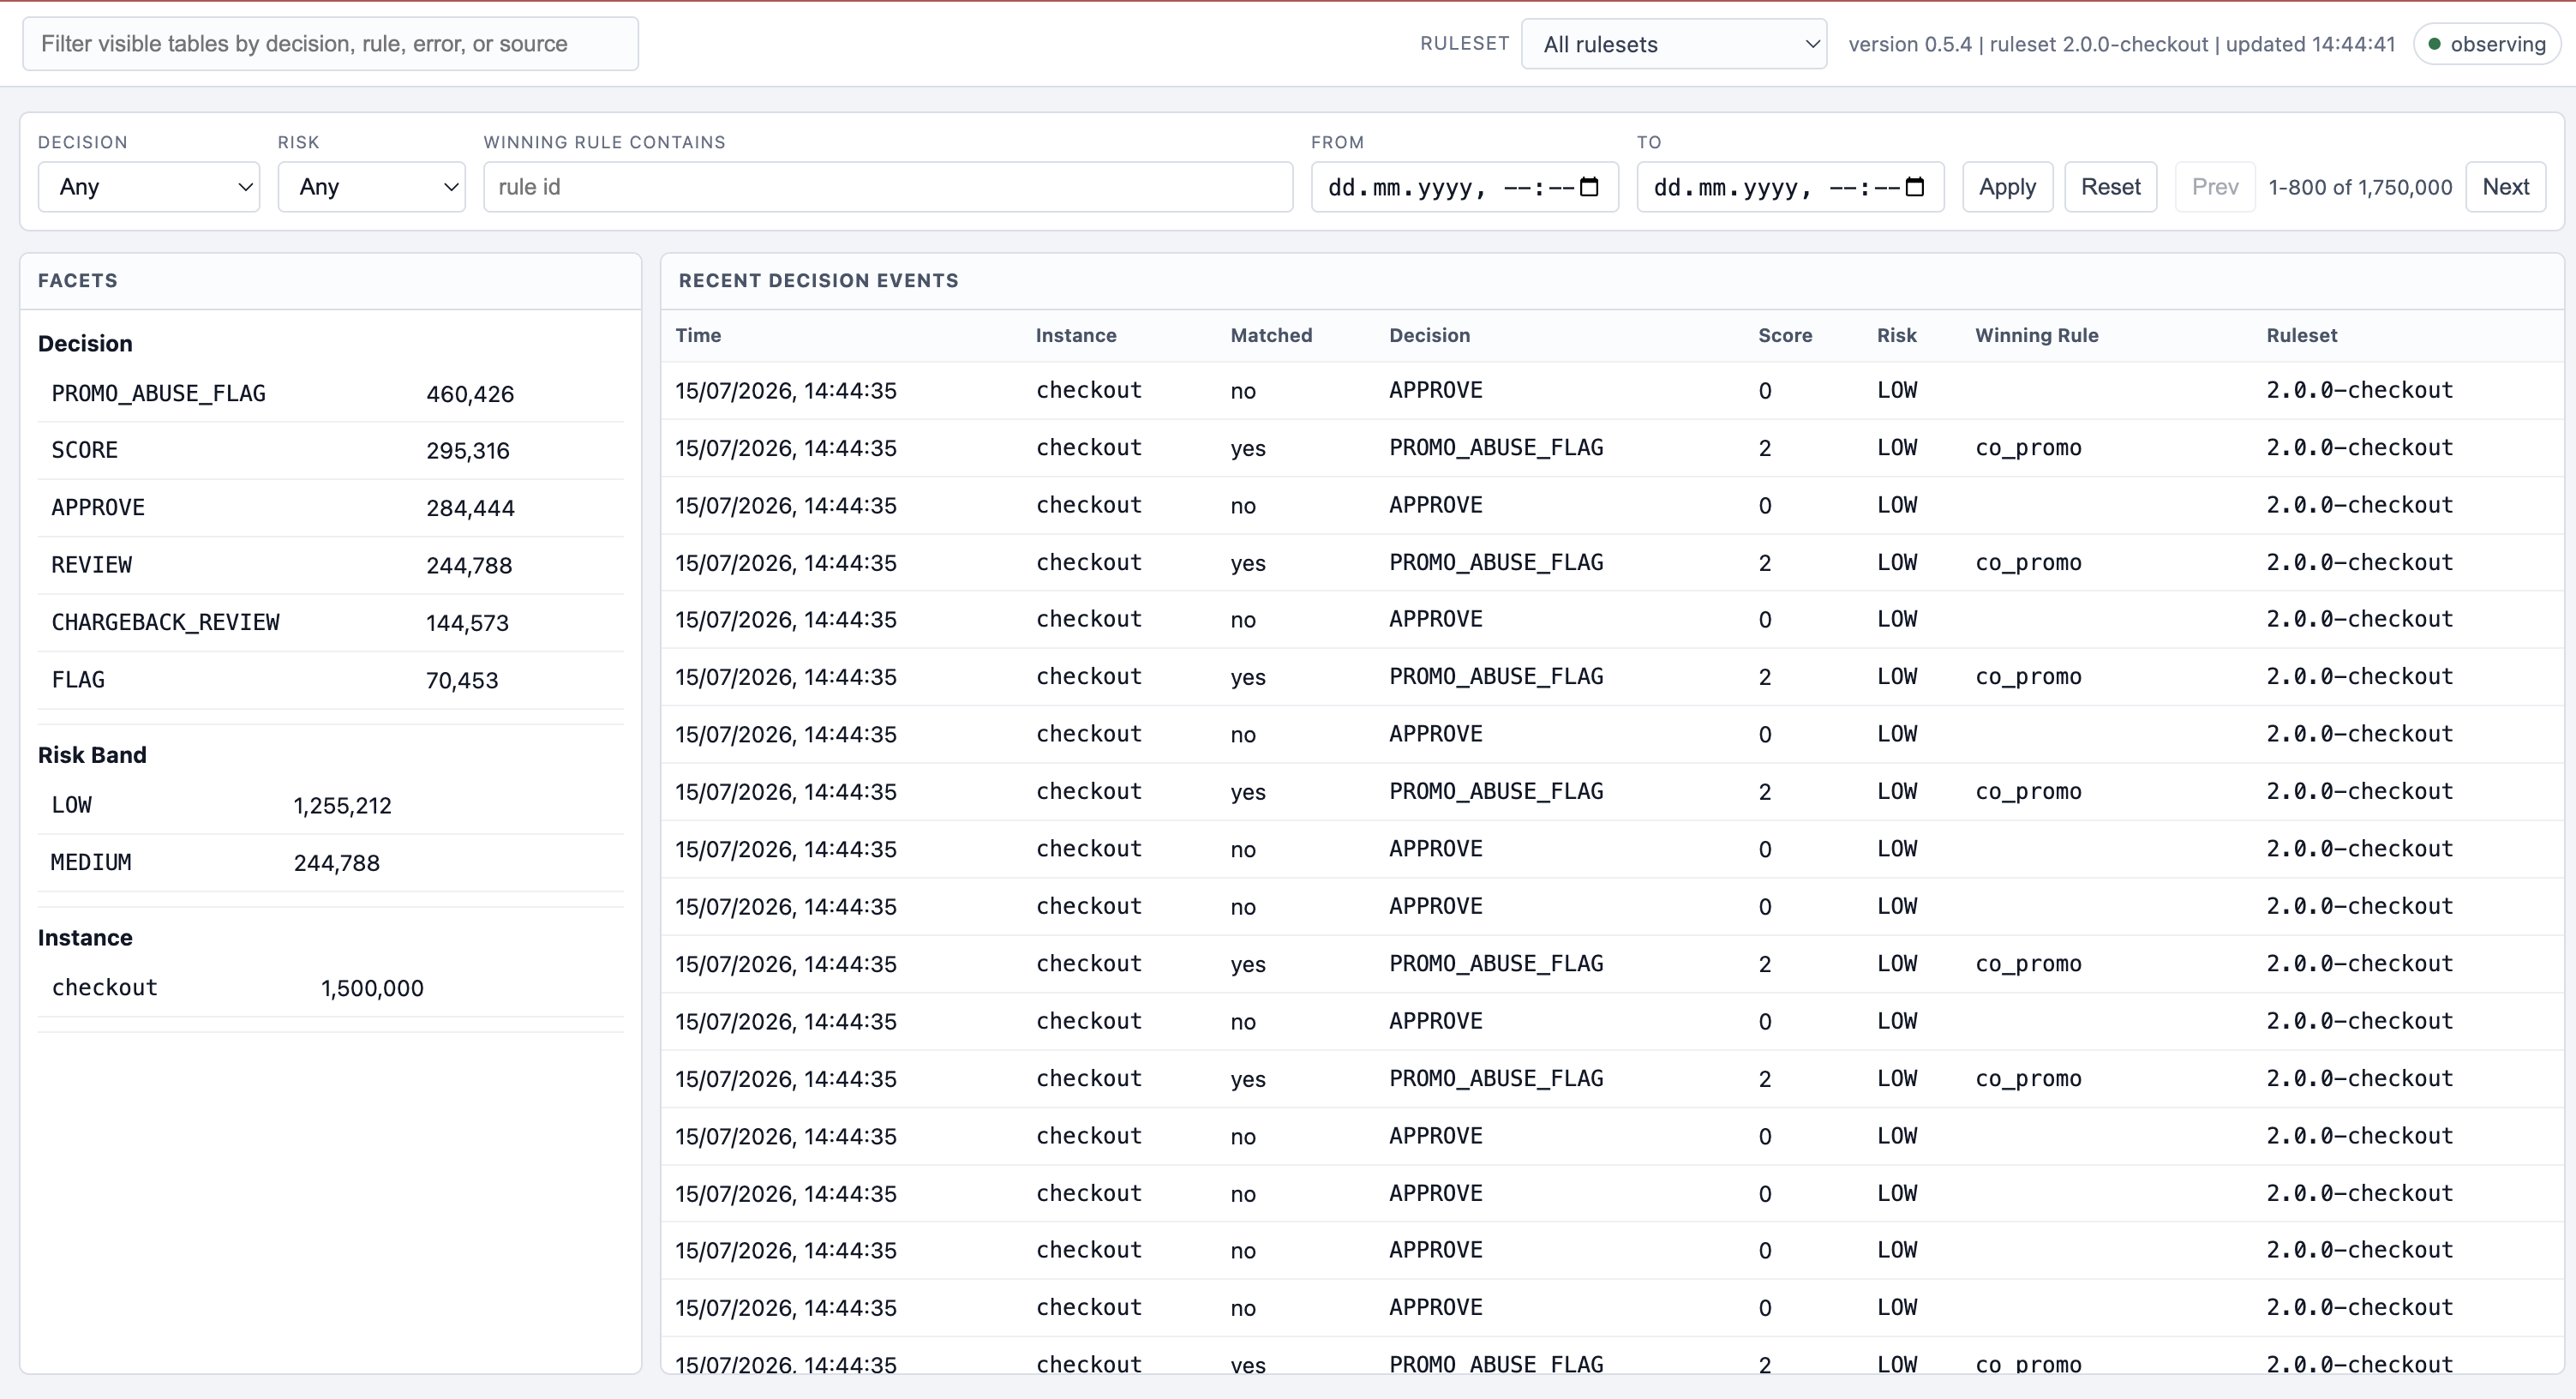
Inspect your traffic, filter events across millions of records.
The table updates in real-time as new events arrive. The filters allow you to focus on a specific decision, risk, rule, or ruleset.
Event rate
Evaluated records in each time bucket.
Time Filter
View events within a specific time range.
Decision events
Filter recent rows by decision, risk, rule, instance, or ruleset.
03 / RULE FIRE RATES
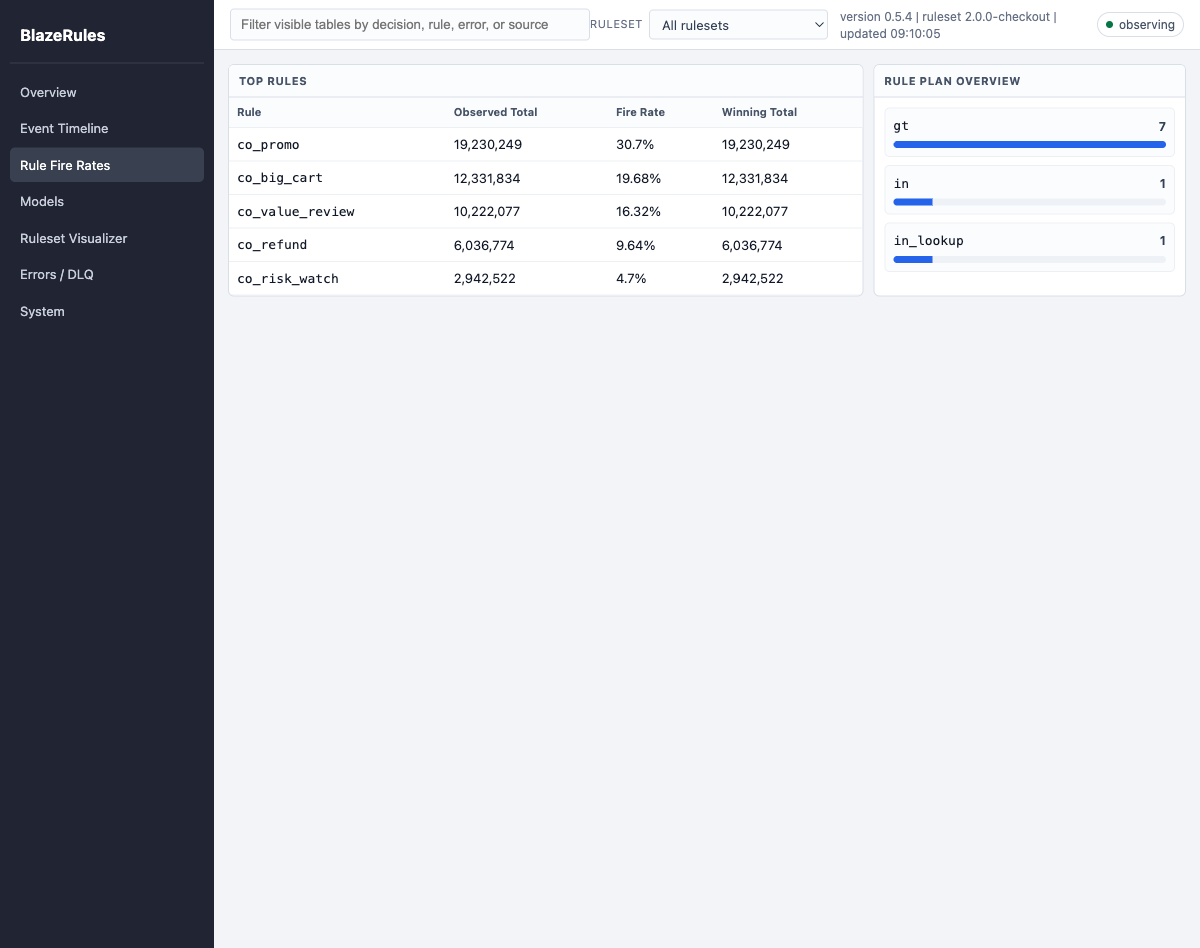
Find rules that dominate, drift, or never fire.
Observed totals show every rule match. Winning totals show the rules that determined final outcomes. The distinction makes it easier to spot broad predicates, dead rules, and precedence effects.
Rule plan overview
Operator counts summarize the compiled plan without exposing the full YAML in this view.
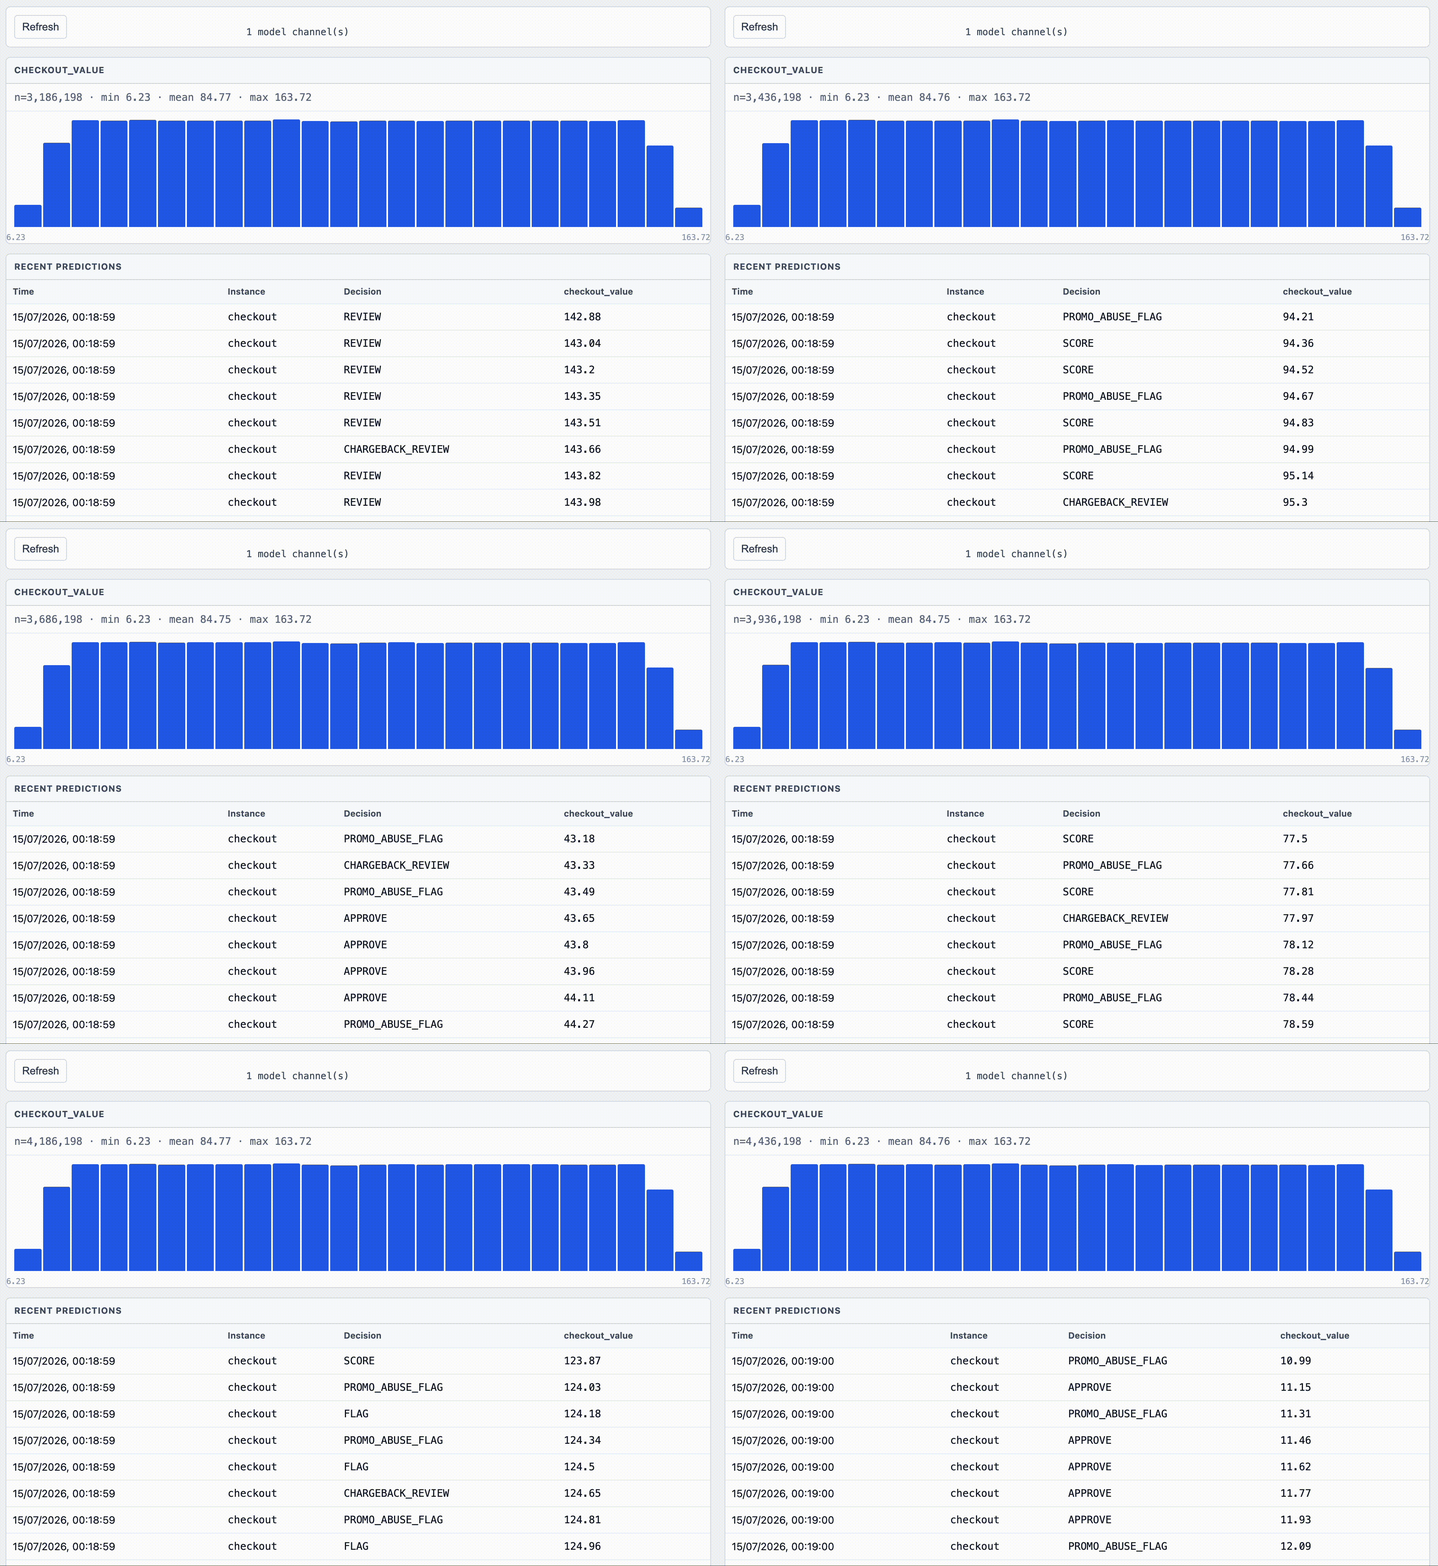
04 / MODELS
Connect model output to the decision that used it.
Each named model channel gets its own distribution with sample count, minimum, mean, and maximum. Recent predictions connect a score back to the instance and final decision.
- 01Inspect model output distributions and changes over time.
- 02Compare channels registered by different engine instances.
- 03Trace predictions to decisions without logging the raw payload.
05 / RULESET VISUALIZER
Read the active plan without leaving the operations view.
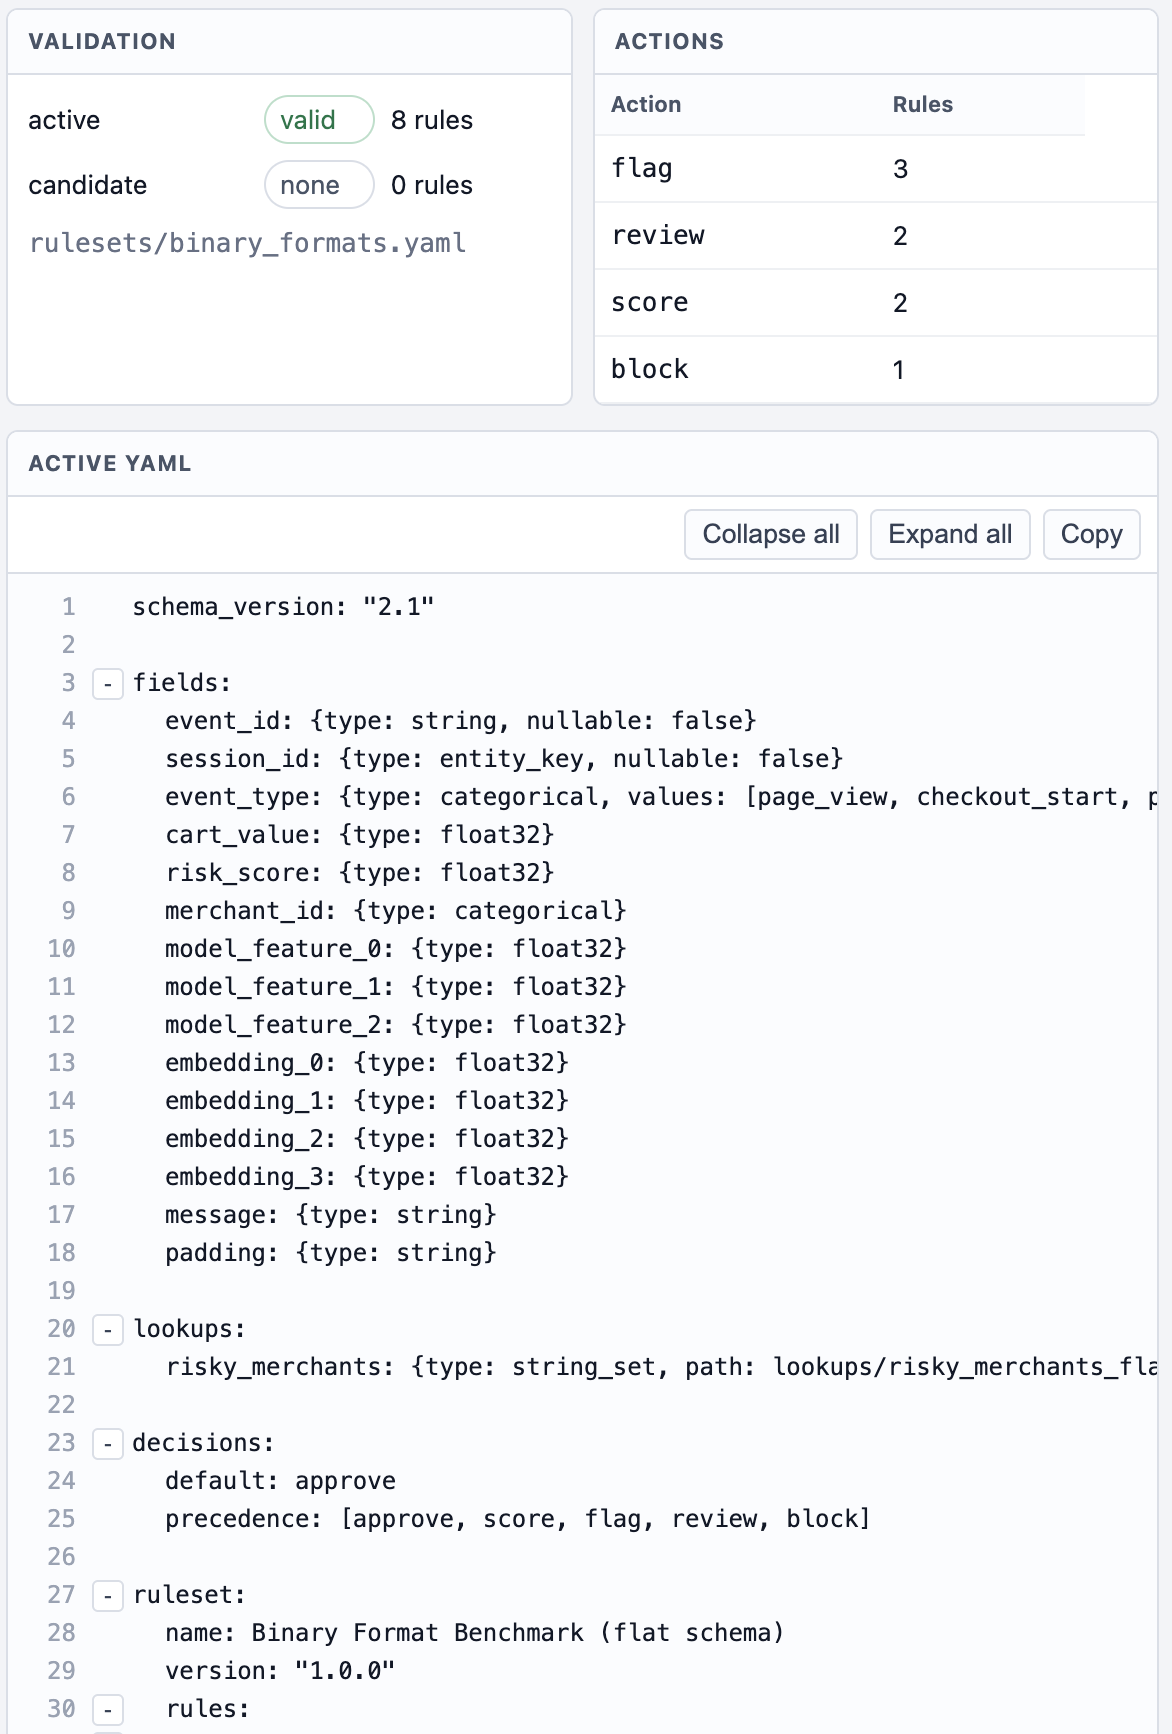
Validation status, rule counts, actions, and the source YAML appear together. Fold individual YAML branches or collapse the complete document when inspecting a large ruleset.
This is a read-only visualizer. Rule editing and activation stay outside the dashboard process.
06 / ERRORS & DLQ
Keep bad input visible without mixing it into decisions.
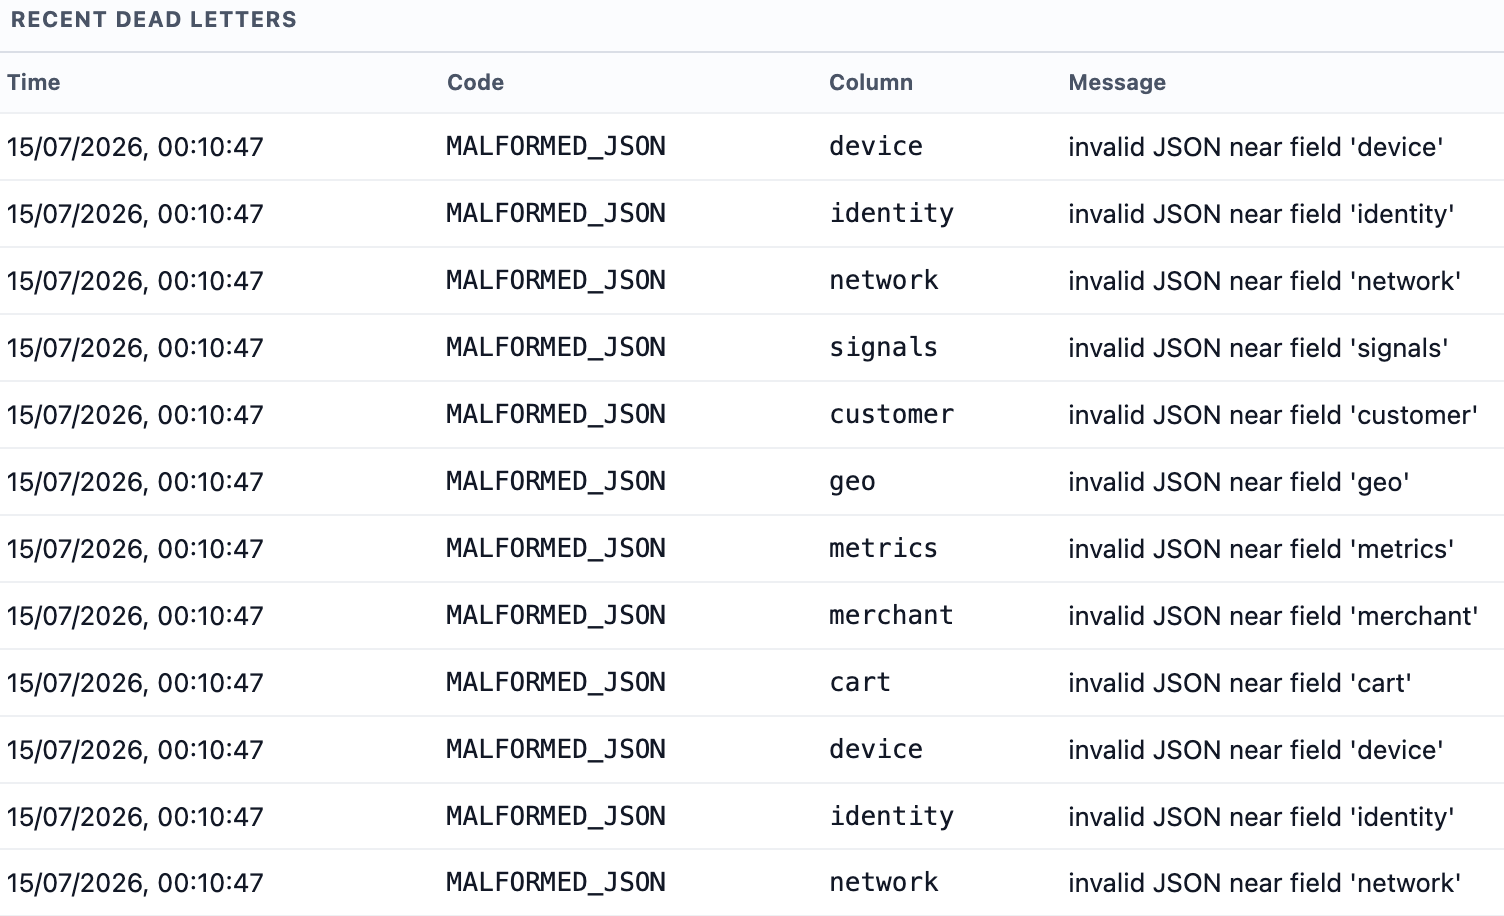
Error counts show the scale of each ingest failure. Recent dead-letter rows preserve the timestamp, error code, affected column, and compact diagnostic message for triage.
Instance-aware inspection
Filter the dashboard to one ruleset so checkout, fraud, or other local agents do not share the same error view.
07 / SYSTEM
Confirm what the dashboard is actually watching.
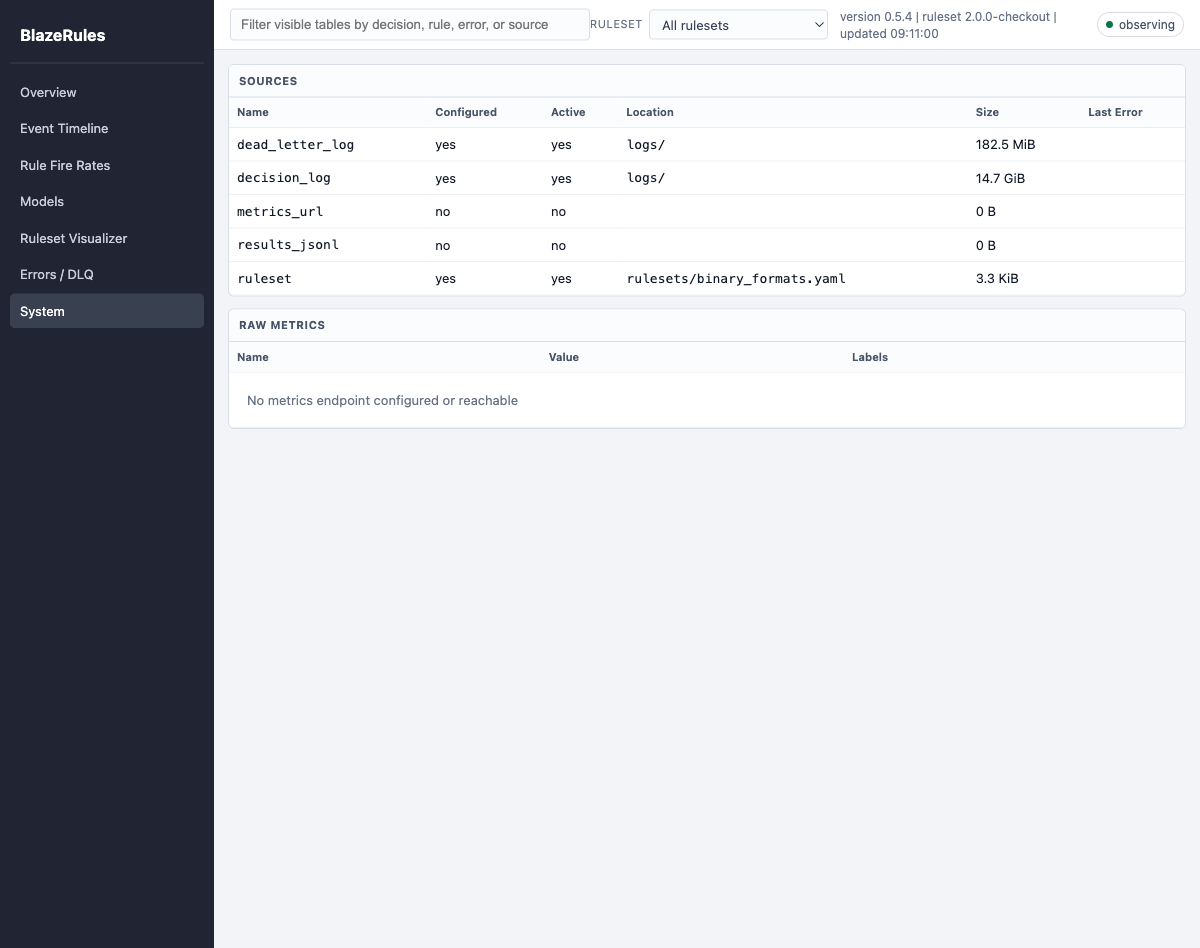
The System view lists every configured source, whether it is active, its path or endpoint, current size, and the latest collector error. Raw metrics appear here when a metrics endpoint is configured.
Missing optional sources remain visible as inactive rather than preventing the dashboard from starting.
READ-ONLY BY DESIGN
Start the dashboard beside the data plane.
The server observes files and sidecar statistics already produced by BlazeRules. It does not evaluate events, mutate rules, or sit between the agent and its output sink.
blazerules_dashboard \
  --decision-log-dir logs/ \
  --rules-dir rulesets/ \
  --host 127.0.0.1 \
  --port 9470